April 27, 2020
London: 1985 and Today
On the Anniversary of ITDP’s 35th Year, Transport Matters will be publishing a series of articles about cities that ITDP has worked in, comparing them from 1985 and today. The article in full can be found in the Sustainable Transport Magazine. Read previous articles about Buenos Aires here, Chennai here, Rio de Janeiro here, Dar es Salaam here, Mexico City here and Guangzhou here.
Thirty-five years ago, London was struggling with growing traffic congestion and pollution. Margaret Thatcher’s government fought against a greater commitment to transit, and passed a sweeping national deregulation and privatization policy called the Transport Act of 1985. Today, London is a very different city. According to Transport for London, over half of trips in London are made by bus, walking, or cycling. The city anticipates that fewer and fewer trips will be made by cars, a shift that can be attributed almost directly to the city’s many efforts both to decrease cars and improve all other sustainable transit modes. Much of London’s success in enacting pedestrian and cyclist forward initiatives is because it has a strong public transportation network to rely on. London can serve more of its community, continue to lower emissions, and focus on building from its many successes in the past 35 years.
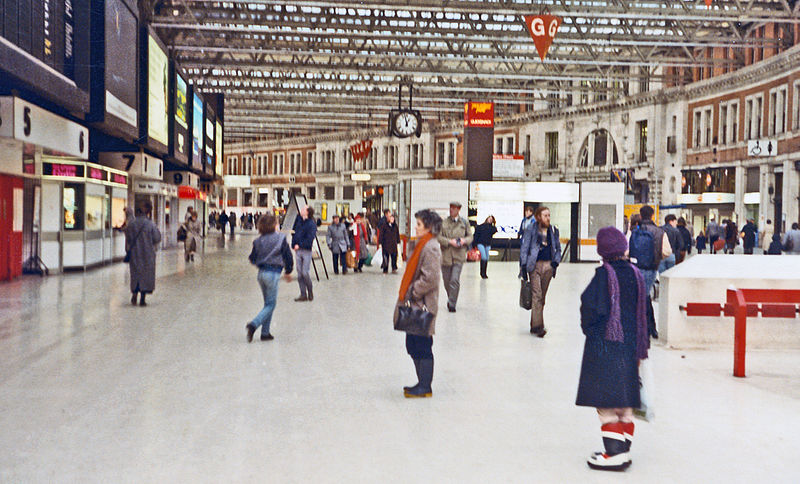
London Before
Click below photos to enlarge


London may be best known in the transport world for its famed London Underground, the oldest Metro in the world, and one of the longest, at 402 kilometers. London also has one of the largest bus network in the world, featuring 24-hour service with 8500 buses, 700 routes, and 19,500 stops. However, London’s exceptional commitment to cycling deserves equal praise. The cycle sharing service saw a record 10.5 million journeys made in 2019 with an average of almost 30,000 trips every day, and annual membership to the bike share, Santander Cycles, is growing every year and is its highest at 360,000. Cycling has become more popular and remains on the rise with increased routes. London’s Cycle Network includes 900 kilometers of bike lanes, greenways, and recently established cycle superhighways, and 15 kilometers of quietway cycle routes. London’s transit successes have also been made possible by improved management, with the creation of Transport for London (TfL), enabling integrated fares with the Oyster Card, and an overall improved approach to connecting Londoners throughout the city.
London Today
Click below photos to enlarge


London won the Sustainable Transportation Award in 2008 for the expansion of its successful congestion pricing scheme, by increasing motor vehicle fees, increasing the size of the congestion zone, and expanding tolls to be city-wide. As a result of congestion pricing, the number cars into London have decreased by 35 percent. The accompanying Low-Emission Zone (LEZ) has managed to improve air quality so much that in 2019 London enacted an Ultra-Low Emission Zone which further restricts vehicle and charges a higher fee, the and ULEZ has resulted in a 20% reduction in emissions and in six months has decreased highly polluting vehicles by 40,000 cars over six months.
London in Numbers
Of all the cities surveyed in this project, London has had the highest RTR of all cities. London has the world’s oldest underground metro and has been a city invested in public transit for over a century. This strong foundation of public transit has allowed London to focus on other sustainable transportation measures like cycling and congestion pricing. Like all the other cities in this project, metrics were employed to study each city. The population, density, built up area, kilometers of rapid transit (defined as rapid transit that meets the definition of BRT basics in the BRT Standard), and RTR. Rapid Transit to Resident Ratio (RTR) is a helpful metric that measures the population of a city against the length of rapid transit lines, essentially demonstrating how many people are served by rapid transit. London started out with an RTR of 52.82 in 1985, and it actually dropped down to 51.78 in 2018. Does this mean that London’s public transit has reached its peak? Not necessarily, but it does indicate that with enough people served through public transit, the city can focus on other sustainable modes like cycling, walking, and congestion pricing. London’s growth in population has been closely matched by its rapid transit growth.

